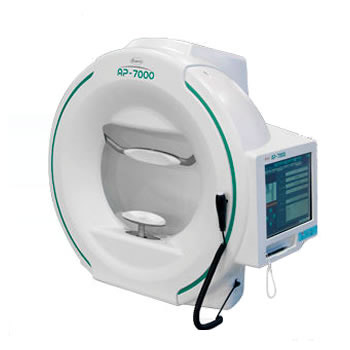

Kowa AP-7000
 Or please call FAISAL: 079 242 2817 or AHMED: 082 414 1472
30 Years of Perimeter Experience, and It Just Got Better!
![]() Click here to view the pdf advertisement
Click here to view the pdf advertisement
![]() Click here to view the pdf brochure
Click here to view the pdf brochure
![]() Click here to view the pdf catalogue
Click here to view the pdf catalogue
![]() Click here to view the pdf guide
Click here to view the pdf guide
Kowa's extensive normative database considers both the central field and the periphery thus ensuring consistent, accurate assessments when using a Kowa AP-7000 perimeter. Full threshold modes offer macular, central, and peripheral coverage up to 80°, while screening modes provide swift evaluation of the visual field. To shorten test times, quick modes are available for both threshold and screening modes. Static perimetry can be linked with fundus images from cameras, OCT, and SLO to define specific test locations on the retina. With its ergonomic, compact design, the AP-7000 offers additional comfort to patients, easy operation for the clinician, and fits perfectly within the practice.
Fundus Oriented Perimetry
Static perimetry tests can be applied to areas of interest on fundus images taken from a retinal camera, OCT, or SLO. Threshold test within the central 10°, custom optional threshold test that allows selection of any desired test points, and custom optional screening tests are available.
Threshold
In addition to central 30° used to observe the progression of glaucoma, other tests are available such as central 10° which can identify visual field abnormalities in the macula.
Analysis Indices
GHT (Glaucoma Hemifield Test)
For this index, threshold central test points are divided into 10 sectors, and corresponding sectors above and below the axis of the horizontal median are compared.
VFI (Visual Field Index)
A percentage index in which a normal visual field is 100% , and total loss of visual field is 0%
Anderson's Criteria Diagnostic Support Function
This criteria is for glaucomatous visual field defect.
If any of the following conditions are satisfied, the colors turn orange.
- PSD has p<5%
- GHT is outside normal limits
- Pattern deviation probability plot shows a cluster of 3 or more nonedge points
that have p<5%, and one of the points has p<1%
(The physician must judge whether the 3 points match the travel of NFL.)
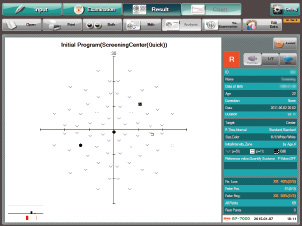
Chronological Change Display
Test result analysis indices can be graphically displayed as time series data to give a clear grasp of changes over time in the tested eyes.
Screening
4-zone measurement that goes beyond screening, and programs using probability values (p-values), are among the features that enable effective testing in less time.
Running tests with probability value (p-value) intensities makes it possible to display the difference between the measured value and the normal value for each age range as a p-value, so that the evaluation equivalent to total deviation in thresholds can be performed in a shorter time.
